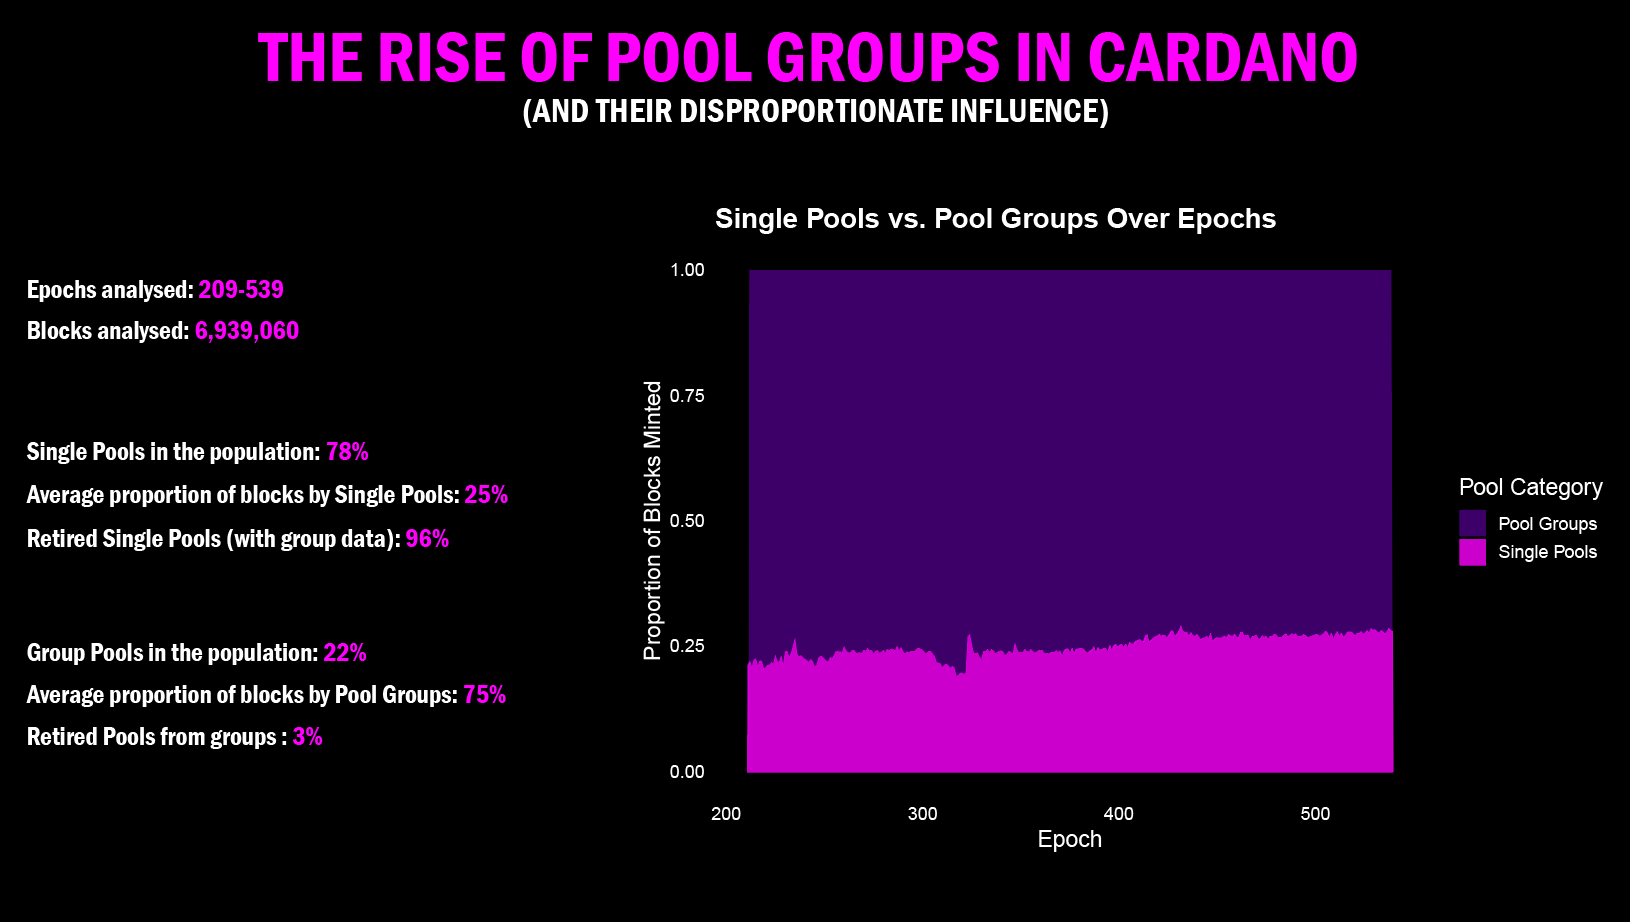
Here I will take a close look at block production in Cardano since the advent of Shelley (epoch 209) in terms of Pool groups participating in the protocol. These analyses were conducted independently and cover epochs 209 through to 539, spanning a total of 6,939,060 blocks. I wish to thank Balance for the identification and publication of all currently known Pool groups used herein. Group data used in these analyses were fetched from Balance Pool’s API in late February 2025 and have been added to the GitHub repo associated with this write-up (linked below) to be compared (if desired) with the latest group data available through the same API here.
Known Pool groups are becoming more numerous in Cardano. The groups used in this analysis belong to a wide range of types: from well established, easy to identify MultiPool groups run by Centralised Exchanges (CEXs) to MultiPool groups that came to light only thanks to extensive blockchain data forensics.
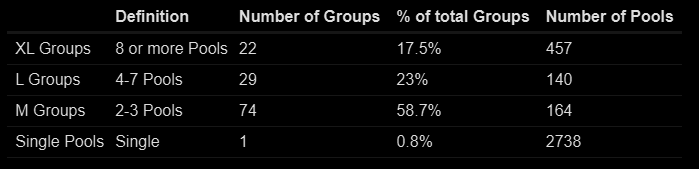
There are 126 currently known Pool groups. For the purposes of the analyses presented here, groups were further classified, based on the number of Pools in them (Table 1).
Not all Pool groups behave and represent themselves in the same way. Therefore, different groups (and different size groups) are expected to show variation in performance through time. Let’s examine the top 22 Pool groups by number of Pools (XL Groups) and track their influence on Cardano block production through time (Figure 1). Single Pools were removed as a group from this analysis and will be treated separately.
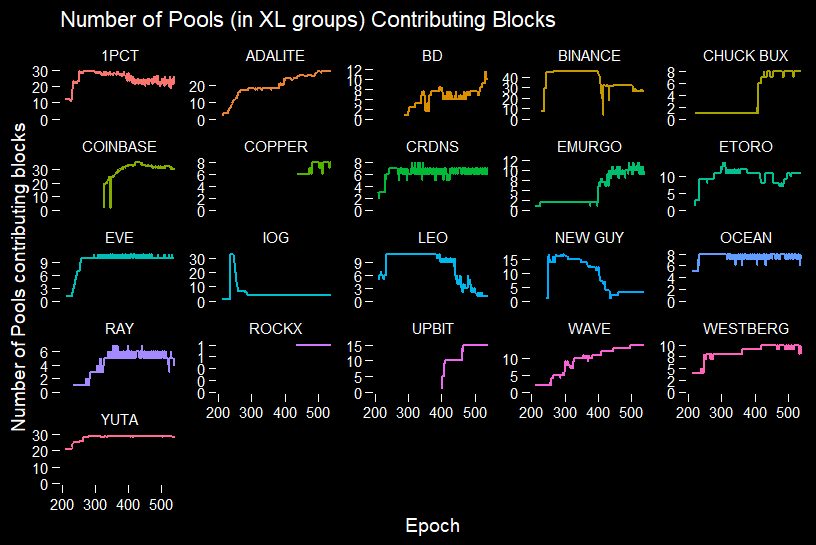
Without going into details for all specific XL groups, we notice that some groups have seen their influence on block production steadily increase over time: this is indicated by the representation of Pools in Cardano blocks over epochs (Figure 1). Conversely, other groups have lost influence over block production over the same period (Figure 1).
Two XL groups deserve a special treatment here: ASTRL and ROCKX (Figure 1). Despite having 10 Pools in its group, ASTRL never minted a single block (absent in Figure 1). All Pools in this group contain (and, as far as I could tell, have always contained) less than 200 ADA each, making the probability of slot assignment negligible. It is not my role to give explanations as to why anyone would go through the trouble of doing this, but asking the question may be relevant in the future. ROCKX on the other hand is never represented by more than one Pool in any given epoch (Figure 1). This is because 8 out of 10 ROCKX Pools have never met their pledge, one has never had more than 20,000 ADA in it and the last is the only one running with a considerable stake delegation.
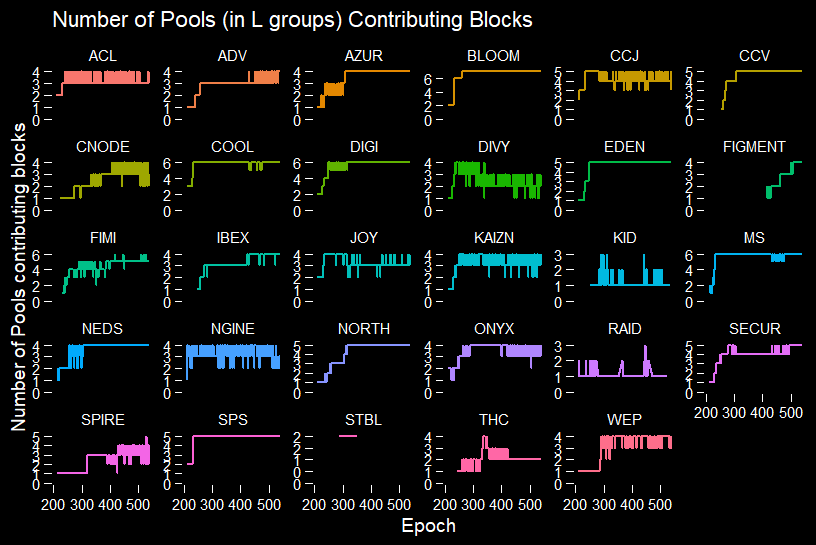
Similar observations can be made for L groups (Figure 2). Here we see some groups stabilizing the number of contributing Pools over epochs, indicating that Pools in those groups have grown to thresholds of stake that allow them to mint blocks every epoch (Figure 2). Other groups had short contributions to the chain and then disappeared, others again saw their influence on block production decrease through time (Figure 2). Overall, the XL and L groups’ landscape seems stable in terms of how many Pools in these groups regularly mint blocks, particularly after epoch 257 (d=0) (Figures 1, 2).
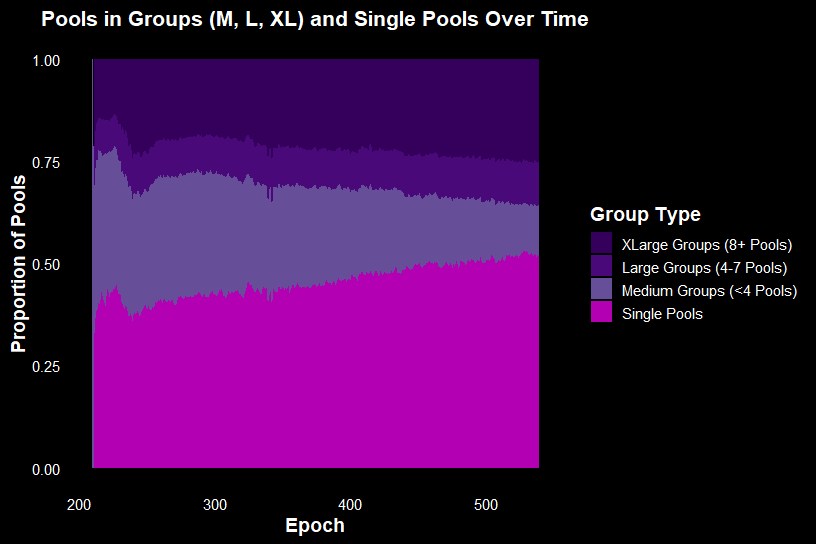
The proportion of Pools (minting blocks in any given epoch) belonging to different size groups is not stable through time (Figure 3). The relative stability observed above, when “zooming in” on specific groups, is replaced by clear trends in “winners” and “losers” when looking at general patterns through time (Figure 3). Specifically, XL groups have been steadily minting more blocks over time and L groups have occupied a stable niche in block production, to the detriment of M groups, those with 2-3 Pools in them, which seem to be losing influence over time (Figure 3). Although Single Pools also seem to have gained influence, it is important to remember that Single Pools constitute over 78% of the total Pools examined here (2738 out of 3499) and their influence on block production is never close to that (Figure 3).
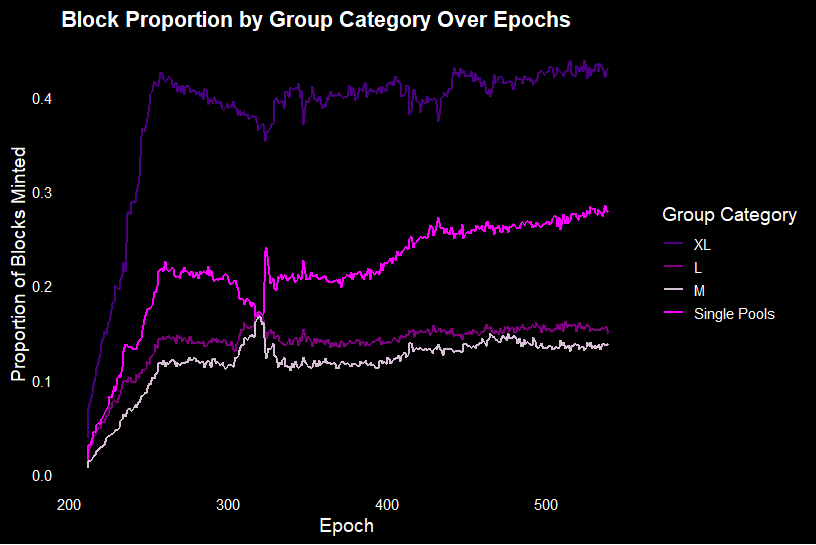
Keeping in mind the disproportionate influence exerted by a relatively small number of Pools (those belonging to groups), we shall look at block production by group size (Figure 4). Here, after the initial increase of Community Pools’ influence as d was gradually being lowered to 0 (epoch 257), group-size-level influence enters a relatively stable pattern (Figure 4). Despite representing just over 13% of the total Pool population (457 out of 3499), XL groups regularly mint over 40% of blocks in any given epoch (Figure 4). Single Pools are distant seconds hovering close to 25%, followed by L and M groups, coming in around 10-12% each (Figure 4). As above, we must keep in mind that Single Pools are by far more numerous than all the other Pools (those in groups) combined, and yet they control less than 25% of blocks (Figure 4).
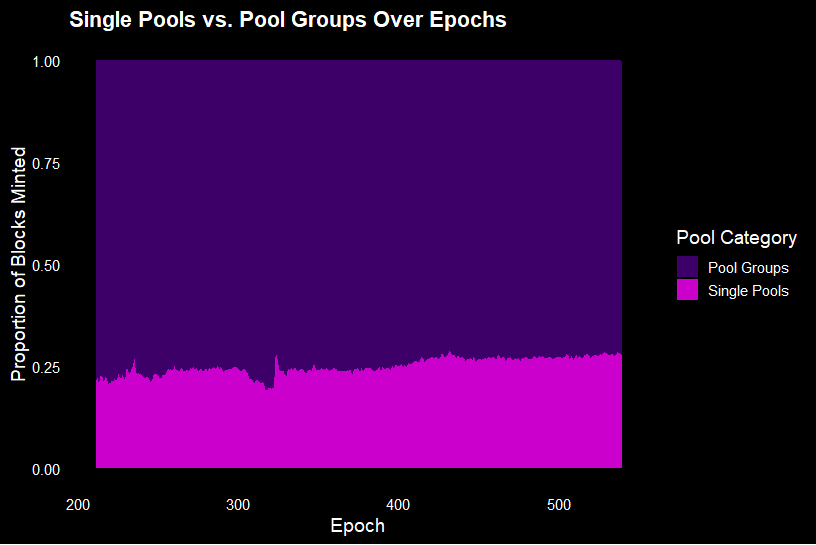
When we treat Single Pools as a separate entity from all Pools belonging to groups, we get an even clearer picture: Single Pools minted a proportion in the range of 19% to 29% of blocks in any given epoch, with an average of 25% (Figure 5). Pool groups, conversely, range between 71% to 81%, with an average of 75% of blocks minted (Figure 5). In short, an overwhelming minority of the Pool population (22%) is consistently responsible for most of the block production in Cardano (Figure 5).
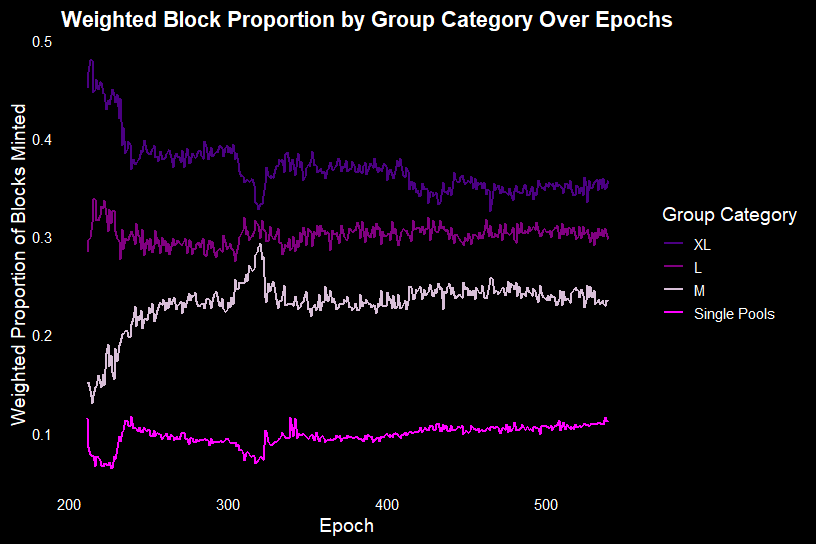
When we weigh block production by number of Pools in a group, the disproportionate influence of Pool groups becomes even more evident (Figure 6). Despite constituting an overwhelming majority by number of Pools (78% of the Pool population), Single Pools hardly ever exerted more than a 10% influence on block production (Figure 6).
In the previous analysis presented here, the number of retired Pools was identified in 1733, 632 of which had previously minted at least one block. So, how many of these retired pools belonged to groups before retirement? After determining that 98 Pools retired prior to epoch 257 (d=0), I was able to match retired Pools to currently available group data. Overall, 577 of the minting retired Pools had no group data available, and of the remaining 55, 53 (96%) were Single Pools.
We have seen that Pool groups have more influence over block production than Single Pools. The total number of Pools contributing blocks to Cardano is shrinking and it appears that those remaining are slowly shifting toward large, consolidated groups (Figure 3). There is further evidence of this trend when we look at the number of entities required to mint 50%+1 of the blocks in any given epoch (Figure 7). Please note that this metric is not the same as MAV (Minimum Attack Vector), because the latter refers to the smallest set of entities controlling 50%+1 of stake. Even though stake influences block production heavily, it is not a 1:1 match, as it considers neither efficiency and performance of Pools, nor luck in slot assignment.
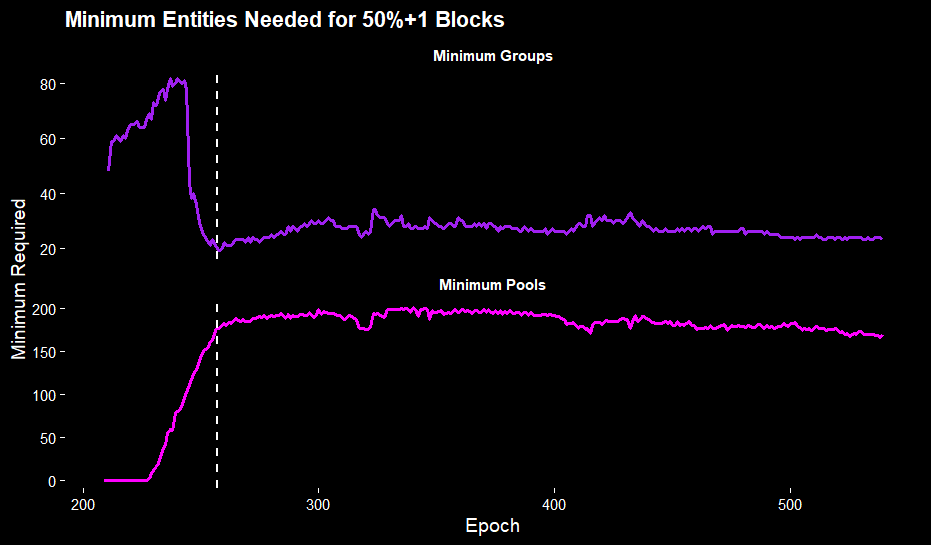
We notice that the number of Pools and groups needed to achieve a 50%+1 majority of blocks is shrinking (Figure 7). Since epoch 257 (when d=0), the maximum number of pools needed to mint over half of Cardano blocks in any given epoch was 201 (epoch 340) and has now declined to a minimum of 166 (epoch 538), with an average of 186 (Figure 7). During the same period, groups needed for half of the blocks ranged from 34 (epoch 323) to 19 (epoch 258), with an average of 26 (Figure 7). These are quite low numbers, very close to the current estimates for MAV, indicating that Cardano is losing decentralisation to the advantage of few, large Pool groups.
Pool groups also show much more longevity and stability than Single Pools (Figure 8). Longevity here is defined as the number of epochs any given group or Pool has been contributing to the system (in other words, how long they have been around for), and stability is defined as the percentage of epochs in which any given group or Pool has been minting blocks.
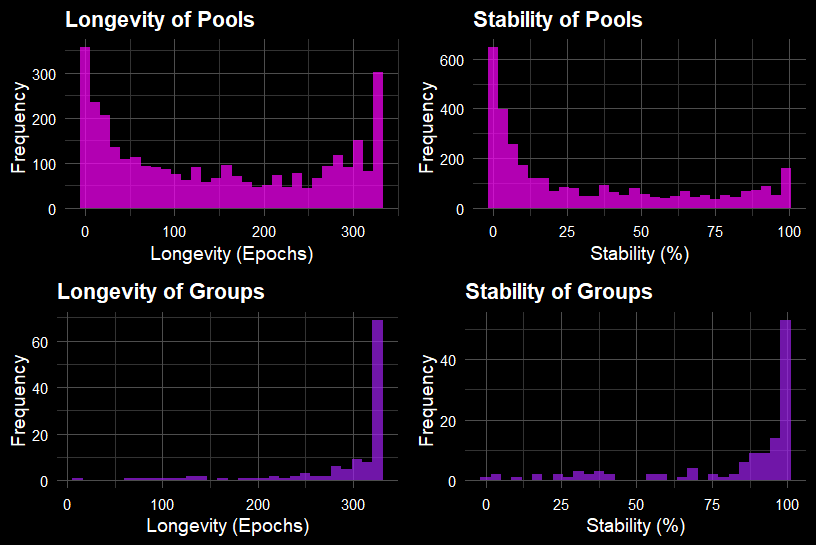
A vast majority of the known groups has existed and continues to exist throughout the period analysed here, so since the Shelley launch (Figure 8). Conversely, the longevity of Pools shows two peaks, corresponding to short-lived Pools and long-lived Pools respectively, with many in between (Figure 8). Stability of block production in Pools also shows most Pools minting blocks infrequently, in stark contrast with known groups (Figure 8). It may be possible to partially explain enhanced longevity and stability in Pool groups with the reluctance to move delegations (a phenomenon known as “sticky stake”), a possibility that will require further analyses.
We have previously seen declining trends in Pool diversity over time and now we have a clearer picture as to where that diversity is being lost from. In future analyses, the inclusion of stake distribution data might shed further light on the apparent dominance of known Pool groups in the Cardano block production landscape.
I wish to thank Wayne [OTG], Rich [ECP] and Homer [AAA] for providing early feedback to this writeup.
This writeup can also be found on the Cardano Forum's Decentralisation Matters topic.

The code to replicate the analyses can be found on GitHub here.
The infographic below can be used on socials to raise awareness to the rise of pool groups in Cardano.