In the present analysis, I look at the distribution of stake in Cardano. The analysis was independently conducted and data span from epoch 210 (August 2020) to epoch 551 (April 2025). In previous analyses presented here, I have looked at block production, both at pool and pool-group level. Although not a 1:1 relationship, stake is widely considered a good predictor of block production for all players involved. Therefore, the expectation is that the asymmetries highlighted in previous analyses, as well as the concentration of power in fewer hands, are going to be reflected in the distribution of stake.
Let’s begin with some overarching considerations: the amount of ADA staked to pools is decreasing (Figure 1, left panel). Staked ADA hit its historical minimum in epoch 409 (20.869B), its historical maximum in epoch 391 (25.528B) and currently sits at 21.802B (epoch 551). The current figure is a lot closer to the historical minimum than the maximum and is a cause of concern in need of further evaluation. Several factors could help explain this trend, including ADA being locked in liquidity pools and centralised exchanges controlling increasing amounts of ADA in preparation of institutional investment.
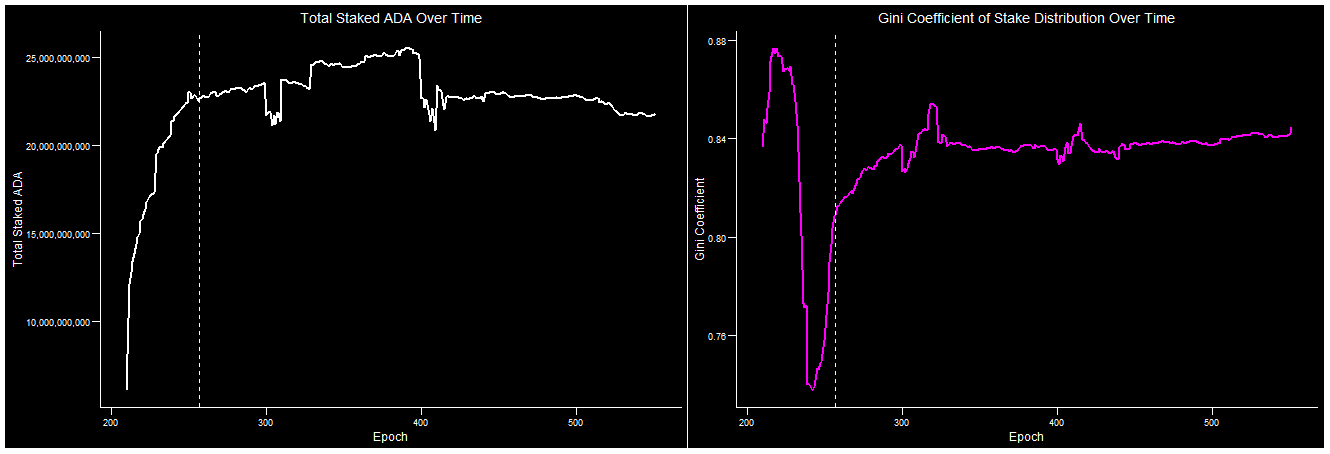
Cardano was not designed as an egalitarian system. Nonetheless, the expectation from the designing cryptographers was that, with the available parameters and if all players ran one pool only, the system would converge to the ideal number of saturated pools (represented by k). This has not come to pass: Cardano’s stake pool landscape never had a distribution of wealth that even remotely resembled equality. This is well captured by Cardano’s Gini Coefficient (Figure 1, right panel): the Gini Coefficient is a statistical measure of wealth distribution, ranging from 0 (perfect equality) to 1 (prefect inequality, where one entity controls all wealth and everyone else none). Since d=0 (epoch 257), Cardano’s Gini Coefficient at stake pool level has ranged between 0.809 and 0.853, currently sitting at 0.844 and showing a slight upward trend. This indicates that wealth (in terms of delegation) is highly skewed toward a small number of large stake pools.
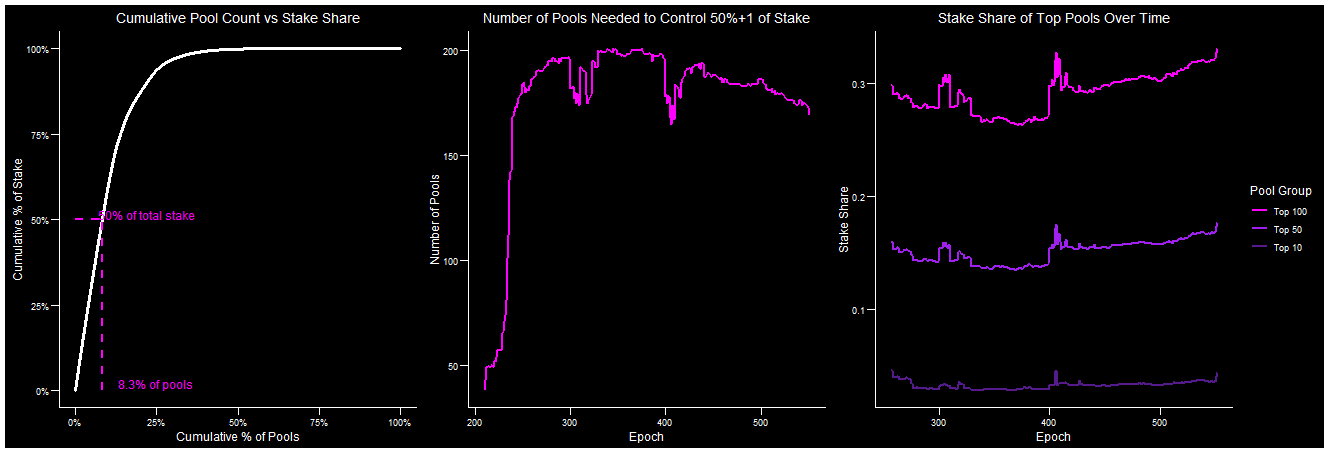
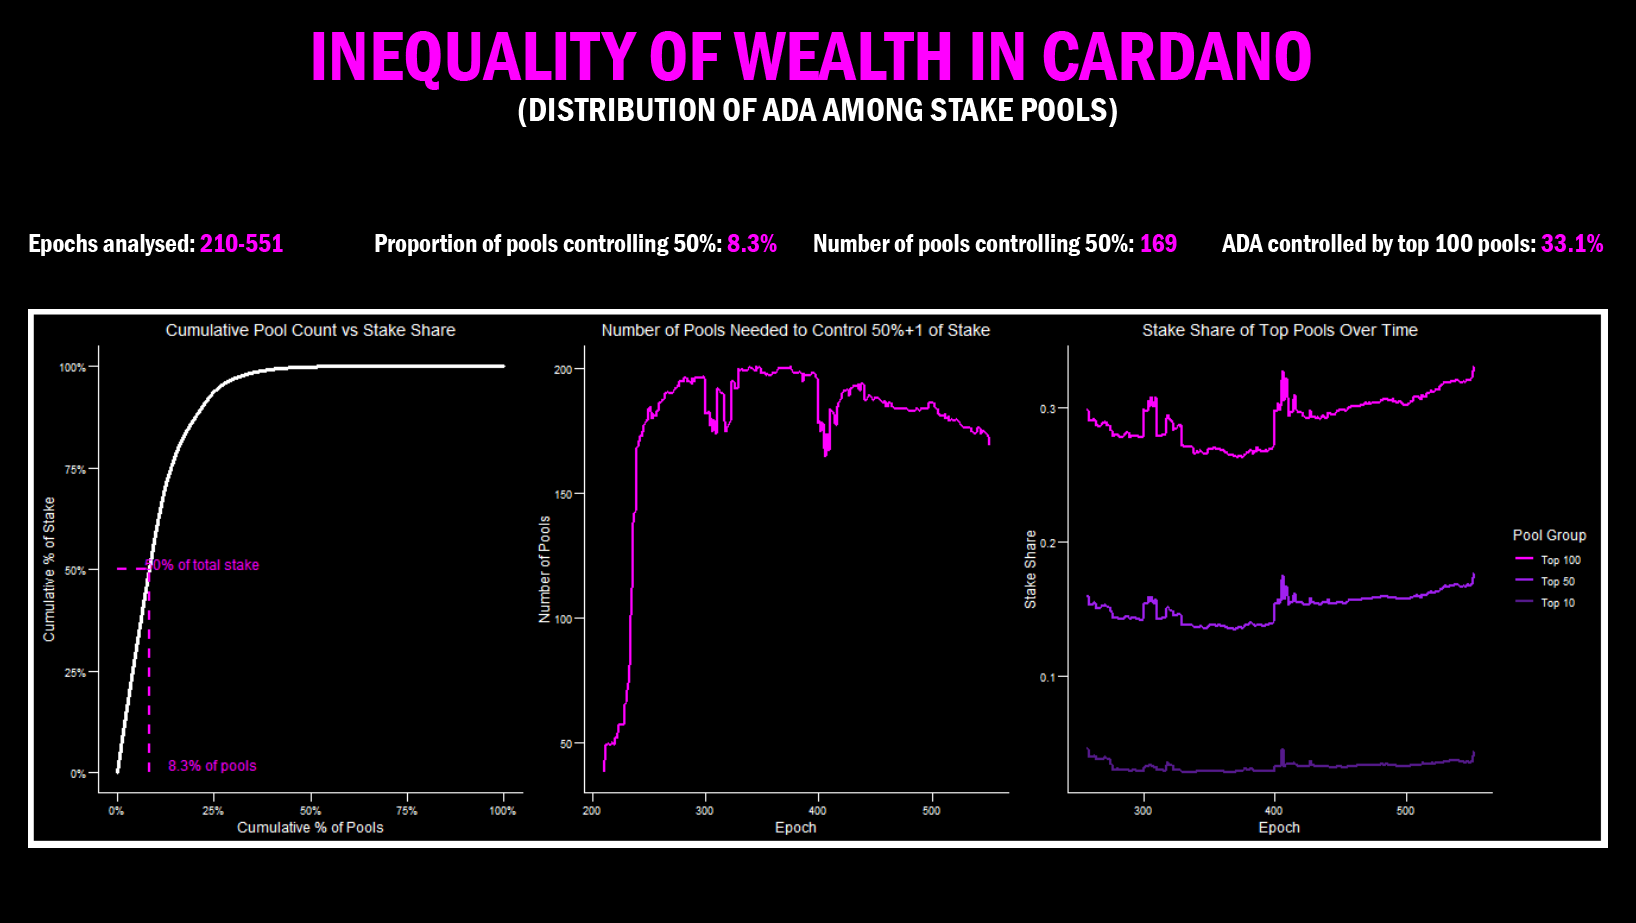
Currently, 8.3% of all pools control 50% of the total staked ADA (Figure 2, left panel). An initial diversification post Shelley has been followed (since epoch 339) by a steady decline in the number of stake pools needed to control 50% of the staked ADA (Figure 2, middle panel). This number has ranged between 165 (epoch 406) and 201 (epoch 339) and currently sits at 169 (epoch 551) (Figure 2, middle panel). Note that this number is not the same as MAV: this is because the current analysis evaluates stake distribution at pool level, without considering known pool groups, something that will be done separately.
In previous analyses we saw that few pools exert a disproportionate influence on block production: the same is true (and expected) for stake delegation (Figure 2, right panel). The decrease in number of stake pools controlling 50% of staked ADA corresponds to a rising influence of the top pools (Figure 2, right panel). The top 10 pools in Cardano control a percentage of staked ADA ranging between 2.7% (epoch 331) and 4.6% (epoch 406), currently sitting at 4.4% (epoch 551). The top 50 pools range from 13.4% of total ADA (epoch 369) to 17.6% (epoch 551). The top 100 pools control a minimum of 26.3% of total (epoch 375) to a current maximum of 33.1% (epoch 551). Noteworthy is that the highest percentage of controlled ADA has been reached now (April 2025) by both the top 50 and top 100 pools (Figure 2, right panel).
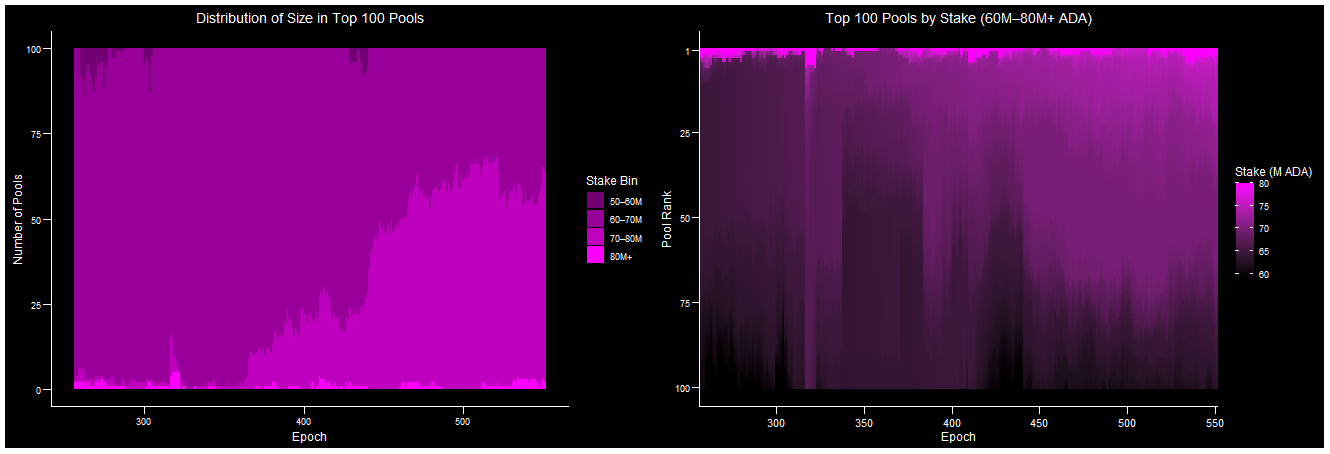
Since d=0 (epoch 257) the top 100 Cardano stake pools have been composed of pools with delegations over 50M ADA (Figure 3, left panel). This is perhaps unsurprising, but there is a notable evolution: in the last couple of years, the prevalence of pools at or near saturation (i.e. in the 70M-80M mark) have all but doubled their presence in the top 100 list (Figure 3, left panel). These large pools now constitute 62% of the top 100, the remaining ones falling into the 60M-70M ADA category (36%) and in the oversaturated 80M+ category (2%) (Figure 3, left panel). Within this 60M-80M+ bracket there is some variability in size, as expected (Figure 3, right panel). Nevertheless, the trend that is emerging here is clear: big pools are getting bigger.
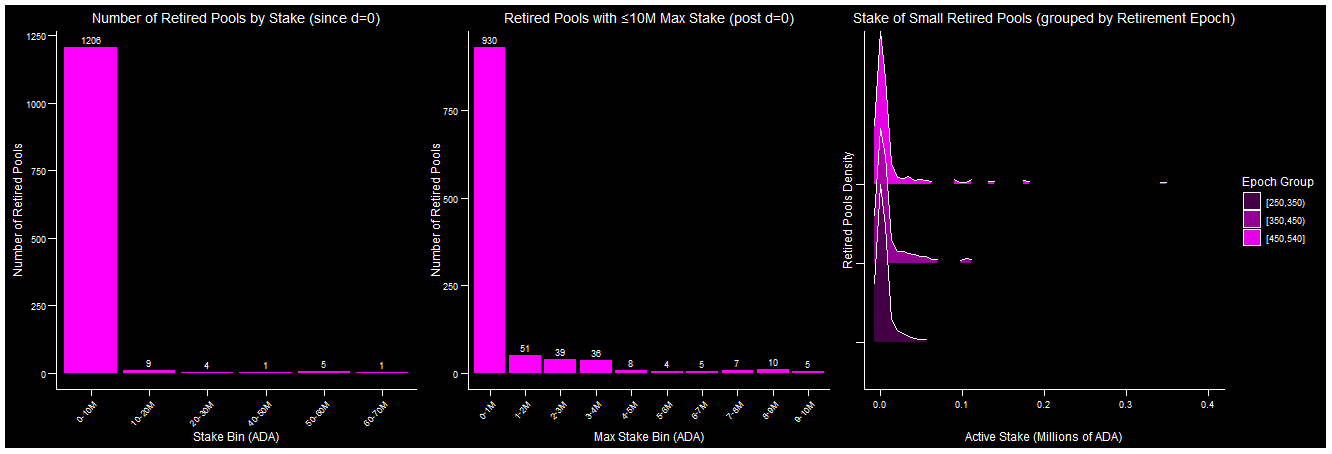
We have seen here that staked ADA is decreasing, so how can we account for the increased flow of ADA into few, large pools? Some of these ADA are coming from the reward pot surely, but some may be coming from retired pools. When looking at the latter in terms of size at retirement, we find that retiring pools are small (Figure 4, left panel). However, this may be an artifact, due to the successful redelegation by stake holders upon the announcement of retirement.
To control for this, the 0-10M ADA cohort of retired pools was further split in 1M ADA bins, this time using maximum lifetime stake as a metric (Figure 4, middle panel): most retiring small pools never had delegations above 1M ADA. Nevertheless, over 160 pools (with k at 500 this equates to nearly a third of the ideal number of saturated pools) retired after having attained maximum delegations in the range of 2M-10M ADA (Figure 4, middle panel). These delegations of over 500M ADA, or 2.5% of the current total staked ADA, strengthen the dominance of few large pools.
When looking at the time of retirement of extra small pools (Figure 4, right panel), we notice that retirement is ongoing and not confined to any specific time in the past. So, what are the dynamics of retirement? Most retired pools experience a drop in delegation proportionate to their size prior to retirement (Figure 5, left panel). Determining whether this is due to successful communication of retirement on behalf of the operator, or, conversely, a reaction to lost delegation, is beyond the scope of this analysis. The dynamics of delegation in Cardano are complex and human-centric: to fully ascertain whether the drops occur before or after the decision to retire a pool would require individually “following” stake keys.
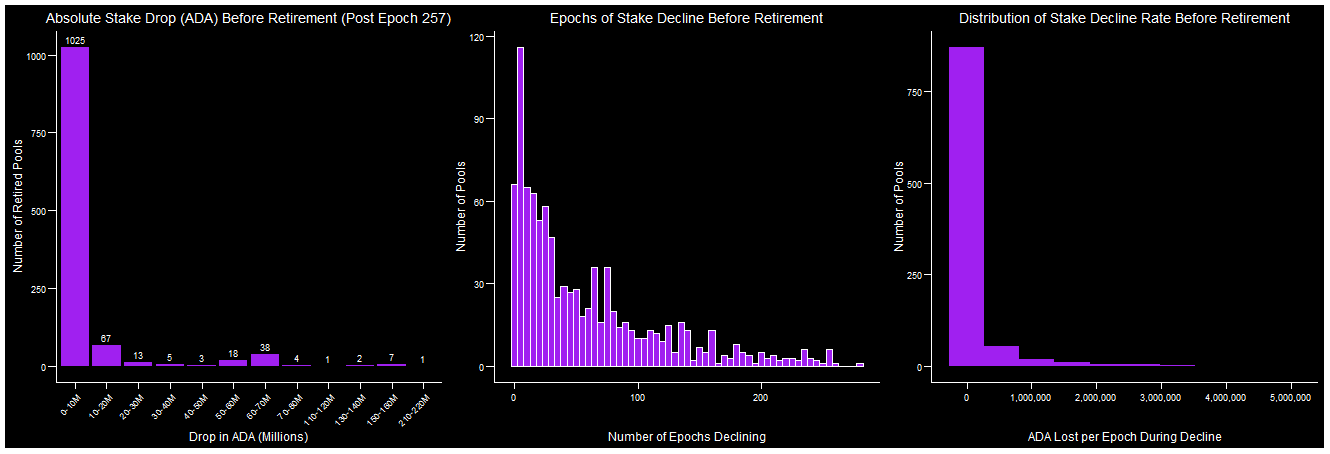
Another interesting observation is that many retired pools experience their drop in stake gradually, over relatively extended periods of time (Figure 5, middle and right panels). This indicates that some retired pools gave the system a fair go before capitulating. This is consistent with what we have seen in previous analyses, showing that many retired pools had actively contributed blocks to the system. Although it is hard to generalise the dynamics and decision-making of pool retirement, the data we have at hand here seem to indicate that many operators consider retirement carefully, perhaps as the culmination of a long process of decline.
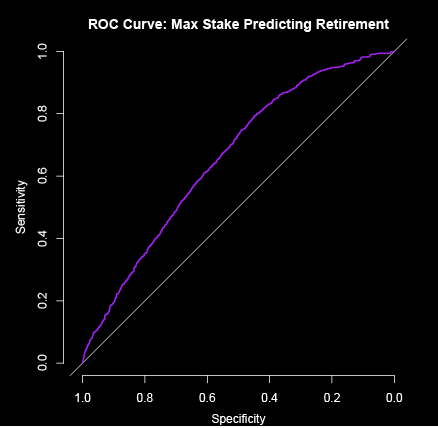
Pool size is a good predictor for the likelihood of retirement. A generalised linear model (GLM) was fitted to empirical data with formula: prob(pool_status == retired)~ max(active_stake). In other terms: “does pool size affect probability of retirement?”. It turns out it does: the model is highly significant (p < 0.001) with a coefficient (log-likelihood) of -2.363e-08. A negative coefficient means that growth of a pool is inversely proportional to retirement probability: adding 10M ADA to a pool makes it 21% less likely to retire. Although highly significant, the relationship between pool size and likelihood of retirement is not exhaustive: the model had a fair fit (Figure 6), indicating that there is unexplained variability. This is expected: as we have seen above, the dynamics of retirement can be highly personal and varied.
In conclusion, this analysis highlights some trends that could be a cause of concern for Cardano: many small pools are retiring and doing so with a much higher degree of probability than big ones. Further, some relatively successful pools retire, leaving ADA to flow toward large pools, further strengthening their dominance. Lastly, the consolidation of stake in the hands of fewer and fewer large pools is increasing the inequality of wealth in Cardano stake pools.
This writeup can also be found on the Cardano Forum's Decentralisation Matters topic.

The code to replicate the analyses can be found on GitHub here.
The infographic below can be used on socials to raise awareness about pool wealth inequality in Cardano.
